
Ronchon
Member
Hi!
I just updated to the latest version. After using the debugger's profile tool, i'm confused to see that it no longer shows a "tree" like in previous versions where you could see in more detail what was going on, having the details of functions used by each object.
Right now it seems to only list objects.
I couldnt find anything in the changelogs for the new versions.
Is there a way to see functions listed in the profile tool again ?
This is what i see. Before there used to be a "+" button for each object so you could open it and see in more details what was taking more processing time.
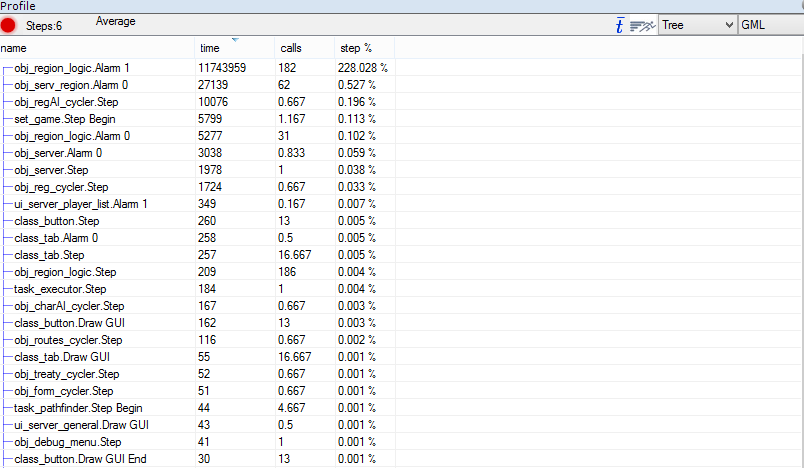
EDIT:
Nevermind, when running a different instance of the game it displayed as before. I though something had been changed by the update.
However there was apparently a bug here.
I just updated to the latest version. After using the debugger's profile tool, i'm confused to see that it no longer shows a "tree" like in previous versions where you could see in more detail what was going on, having the details of functions used by each object.
Right now it seems to only list objects.
I couldnt find anything in the changelogs for the new versions.
Is there a way to see functions listed in the profile tool again ?
This is what i see. Before there used to be a "+" button for each object so you could open it and see in more details what was taking more processing time.
EDIT:
Nevermind, when running a different instance of the game it displayed as before. I though something had been changed by the update.
However there was apparently a bug here.
Last edited: